How To Get a Stack Trace on Windows
2017-01-09
Getting a stack trace from a C++ executable under Windows is not trivial. The key problem is, that in C++ there is no simple stack_trace function and the Windows API only provides StackWalk, not some handy function like glibc's backtrace function.
I will show you how to get a perfect stack trace under windows for all your logging and debugging needs, like such:
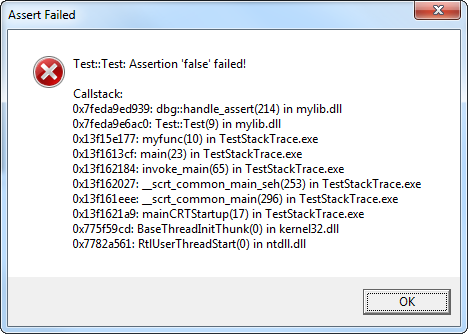
On Windows StackWalk will not do the trick alone, we need the help from the DbgHelp library. But this also means that we need debugging symbols available. So if you want to have a readable stack trace you need to install the PDBs on your users machine. (Some may object to this, but I have no problem with that.)
Note: I am showing the process for x86 builds, for x64 builds it's the same process, only you need a few different types and ids. Also I am omitting error handling for brevity.
First we need to capture the execution context. This is the current machine type, process id, thread id and the current frame pointers.
DWORD machine = IMAGE_FILE_MACHINE_I386;

HANDLE process  = GetCurrentProcess();
HANDLE thread   = GetCurrentThread();
CONTEXT context = {};
context.ContextFlags = CONTEXT_FULL;
RtlCaptureContext(&context);
Also the DebHelp's Symbol API needs to be initialized. We also tell the API to also lode file lines, which can be very helpful if functions tend to get long.
SymInitialize(process, NULL, TRUE);
SymSetOptions(SYMOPT_LOAD_LINES);
To get started, we build the current stack frame, which we know everything about.
STACKFRAME frame = {};
frame.AddrPC.Offset    = context.Eip;
frame.AddrPC.Mode      = AddrModeFlat;
frame.AddrFrame.Offset = context.Ebp;
frame.AddrFrame.Mode   = AddrModeFlat;
frame.AddrStack.Offset = context.Esp;
frame.AddrStack.Mode   = AddrModeFlat;
With the first stack frame built, we call SttackWalk and get further stack frames up the call stack. As long as StackWalk has further frames, it will return with TRUE. StackWalk needs two utility functions, FunctionTableAccessRoutine and GetModuleBaseRoutine and lucky for us, DbgHelp has two already implemented for us.
while (StackWalk(machine, process, thread, &frame, &context , NULL, SymFunctionTableAccess, SymGetModuleBase, NULL))
{
    // extract data
}
All useful data is contained in the STACKFRAME structure, but not in an easy to use way. By emplying the WindowsAPI and DbgHelp's symbol API we can extract the function address, the module name, the function name, the file and line.
DWORD64 functionAddress;
std::string moduleName;
std::string functioName;
std::string file;
unsigned int line;

functionAddress = frame.AddrPC.Offset;

DWORD moduleBase = SymGetModuleBase(process, frame.AddrPC.Offset);
char moduleBuff[MAX_PATH];
if (moduleBase && GetModuleFileNameA((HINSTANCE)moduleBase, moduleBuff , MAX_PATH))
{
    moduleName = moduleBuff ;
}

char symbolBuffer[sizeof(IMAGEHLP_SYMBOL) + 255];
PIMAGEHLP_SYMBOL symbol = (PIMAGEHLP_SYMBOL)symbolBuffer;
symbol->SizeOfStruct = (sizeof IMAGEHLP_SYMBOL) + 255;
symbol->MaxNameLength = 254;

if (SymGetSymFromAddr(process, frame.AddrPC.Offset, NULL, symbol))
{
    functioName = symbol->Name;
}

DWORD  offset = 0;
IMAGEHLP_LINE line;
line.SizeOfStruct = sizeof(IMAGEHLP_LINE);

if (SymGetLineFromAddr(process, frame.AddrPC.Offset, &offset, &line))
{
    file = line.FileName;
    line = line.LineNumber;
}
Finally when we are done using DbgHelp, it is sensible to let it clean up it's internal structures.
SymCleanup(process);
Now you capture the collected data and write a pretty printing function.
If you want to use a finished function you can use my dbg.h, it also contains an improved assert and trace API.
About x64
This is one of the few pieces of code where the difference between x86 and x64 are relevant. The code flow is the same you just need replace a few structures with their 64 Bit counterpart. See my gist about the details.